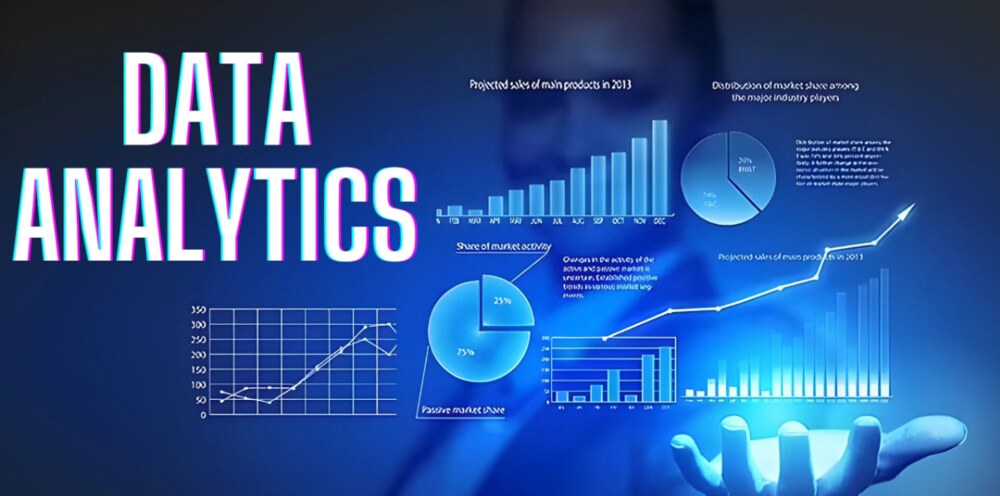
Identifying an issue in sales and correcting it through the simple act of reading how customers behave. That’s the true power of data analytics – making sense of the numbers in the form of smarter decisions. Modern analytics solutions make it easy for an organization to make informed decisions quickly.
At its essence, Data Analytics is the process of collecting, analyzing, and interpreting data to identify trends and unlock hidden opportunities. The question people often ask is whether Data Analytics is difficult—it is quite accessible with the right guidelines at your fingertips and available training programs like the Google Data Analytics Professional Certificate.
This beginner-friendly course describes data analytics in simple terms, covers the essential tools, and breaks down the aspects of what the data and analytics frameworks are, helping to drive clarity into building job-ready, practical skills.
What is Data Analytics?
Data analytics follows a pretty direct definition: collecting, cleaning, and analyzing data in hopes of discovering some actionable insights to drive decisions. Think of it like being a detective: raw data is the crime scene full of clues, while analytics puts those clues together to show you the full story hidden in the numbers.
Experts classify it into four major types:
- Descriptive: What happened? Example: “Sales fell 10% last quarter.”
- Diagnostic: Why did it happen? Example: “A competitor launched a big promotion.”
- Predictive: What could happen? Examples include “Demand may increase 15% next holiday.”
- Prescriptive: What should we do? For example, “Run targeted ads to loyal customers.”
Understanding what data analytics is tends to start with the simple spreadsheet tools. But it scales up to very advanced software that handles billions of data points instantaneously.
It’s already at work in everyday life: recommendations on Netflix, or traffic predictions on Google Maps. The beauty? Chaos turned into clarity.
Is Data Analytics Hard?
The classic question from most beginners: Is data analytics hard?
Well, the honest answer is that it comes with a learning curve, but that does not imply impossibility. Data analytics involves skills such as data querying, pattern identification, and interpretation of results. However, research and learning insights from platforms like Coursera and BrainStation show that most learners can master these basic skills with consistent practice—even without a technical background.
What affects the difficulty?
- Your starting point: Math or basic programming experience makes it easier.
- Key skills: SQL for databases and Python for automation feel tricky at first, but click into place pretty quickly with practice.
- Reality check: Entry roles require commitment, but an abundance of free resources reduces the barrier.
Tips to make it smoother:
- Start small using real-world data (like Kaggle’s free offerings).
- Practice daily consistency beats cramming.
- Treat mistakes as stepping stones.
Whether one solves a puzzle or tries to understand why their favorite team is always losing, they already think like analysts. And, AI tools are simplifying the tough parts and making it more approachable than ever.
Short answer: Data analytics is challenging but certainly learnable with the right tools, guidance, and frame of mind.
Essential Data Analytic Tools
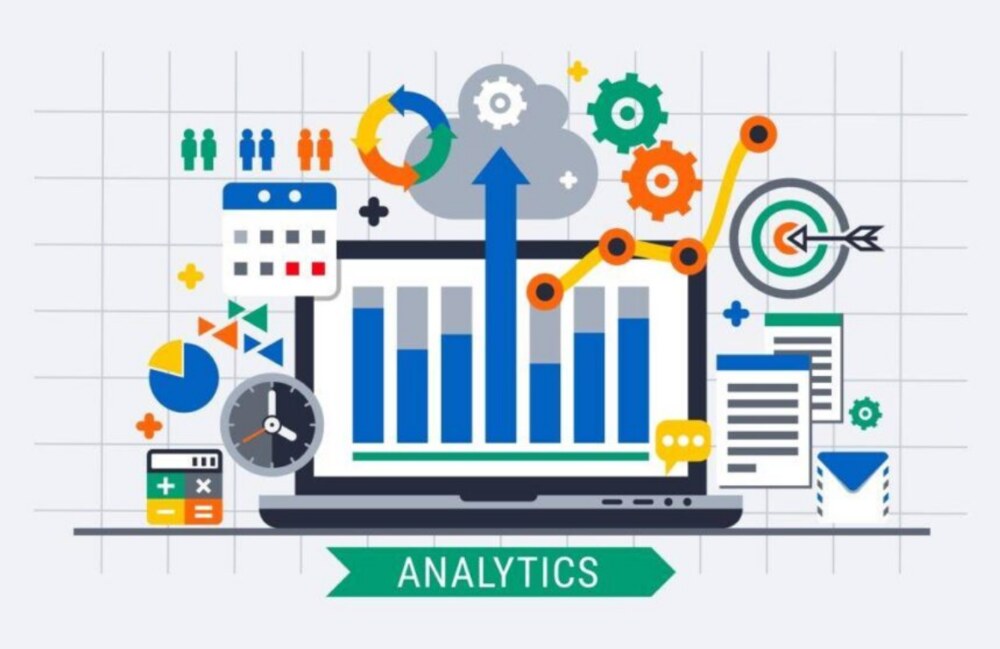
They range in level from simple spreadsheets to AI-powered platforms. Data analytics tools speed up the process of visualization, interpretation, and action by any user.
Here’s a roundup with some fresh twists:
- Tableau and Power BI are leading the way for interactive dashboards. Increasingly, the integrated AI-like Copilot in Power BI automatically provides suggestions for insights.
- Python and R are flexible languages for custom work. Thriving open-source communities mean endless free learning and collaboration.
- SQL: The backbone for pulling data out of databases to have real-time trends.
- Emerging stars: the tools like Julius AI provide no-code analysis, chatting with your data like a virtual analyst.
Quick Pros and Cons:
- Free starters like Google Sheets or Excel: ideal for quick wins, but struggle with huge datasets.
- Enterprise options such as SAS or Databricks: More powerful in large organizations but with correspondingly higher costs and increased complexity.
The unique shift? These tools democratize analytics. Non-experts in remote or hybrid teams can now contribute real insights – no PhDs required.
What are the aspects of the data and analytics framework?
A data and analytics framework is your roadmap: a structured way to handle data from start to finish with reliable, ethical results.
Key aspects include:
- Collection and Ingestion: pulling from sources such as IoT devices, social media, or apps.
- Data processing and cleaning: This includes error fixing, preparation with tools that often involve Apache Spark for speed.
- Analysis and modeling: Use statistics or machine learning to extract more insightful information.
- Governance and security: Guidelines on privacy, bias checks, and compliance-so critical with the growing use of AI.
- Data visualization and reporting: Converting findings into clear charts and stories.
For smooth implementation:
- Align everything to the business goals.
- Build for scale–handle exploding data volumes.
- Embrace the modern touches: edge computing for instant insights at the source.
Frameworks will evolve toward “data mesh” or decentralized ownership and composable systems that speed up analytics, thus making them more adaptable for small teams, too.
Getting Certified: The Google Data Analytics Professional Certificate
The Google Data Analytics Professional Certificate on Coursera remains a top entry point for beginners with experience needed.
Standout Features:
- Duration: Approximately 6 months at 10 hours/week.
-
Skills taught: Data cleaning, visualization, SQL, R programming, spreadsheets, and integrated AI basics
- Cost: Affordable, financial aid available; projects included.
Benefits?
Graduates often land roles with median salaries in the US around $100,000, according to recent data from Glassdoor and Coursera. Success stories are peppered throughout Reddit threads about the switch from retail or teaching into analyst jobs. And it is like a guided bootcamp: practical, employer-recognized, and perfect for testing the waters. Many also say it opened doors they never expected.
Advantages of Data Analytics
For businesses:
Smarter decisions: predictive insights to cut risks and identify opportunities early.
Efficiency gains: Smooths processes, from supply chains in retail to patient care in healthcare.
Personally:
High-demand and flexible careers that allow working remotely.
More wins:
- Cost savings: Catch inefficiencies before they grow.
- Innovation spark: Powers new AI-driven products.
- Broader impact: Helps tackle climate monitoring or personalized education.
The edge sharpens with an ethical AI focus: making insights fair and unbiased for everyone.
Smarter decisions help companies improve business outcomes using data analytics and digital marketing insights.
Data Analytics Implementation in Your Organization
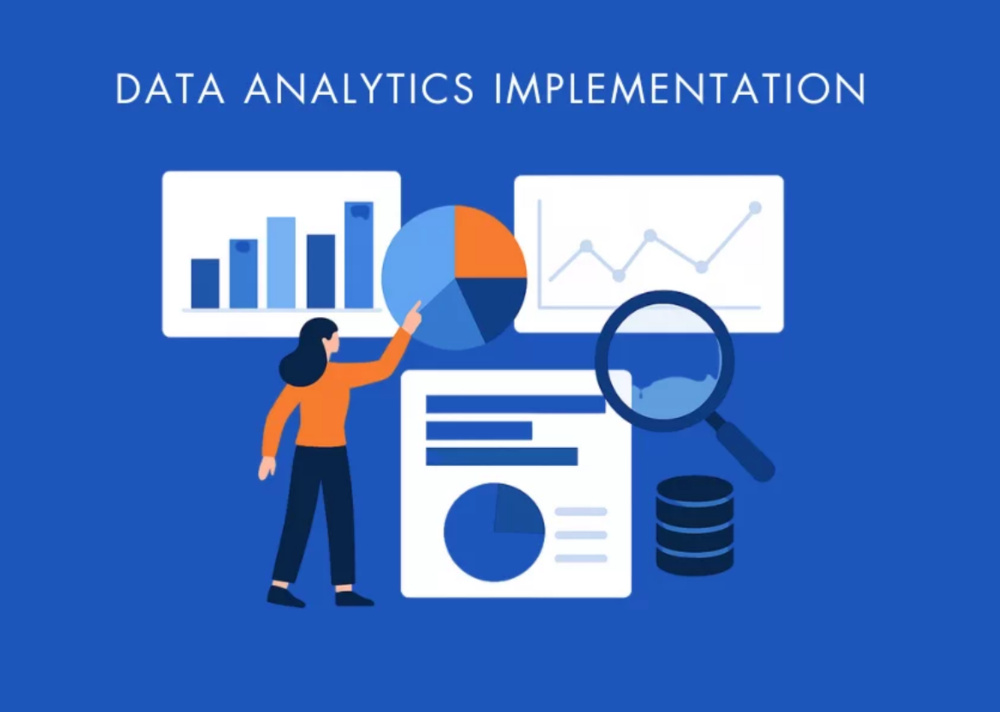
Want to bring analytics in-house? Consider the following:
- Assess Needs: Map your data sources and key questions.
- Team formation: Put together analysts with domain experts to provide real context.
- Choose tools: Start small (e.g., Power BI), then scale.
- Success tracking: Use KPIs like ROI from data-driven changes.
Common hurdles—and fixes:
- Data silos: Break them with unified platforms.
- Skill gaps: Close them through certificates or quick training.
Picture it like planting a garden: nurture your data sources, weed out the bad info, and soon you’ll harvest game-changing results.
Future Trends in Data Analytics
According to Gartner, Deloitte, and McKinsey:
- Generative AI: Automates reporting and can even ask follow-up questions.
- Ethical frameworks: Stronger tools to detect and fix algorithm bias.
- Edge computing: Processing data right where it’s created for lightning-fast insights.
The big picture? These trends are making analytics inclusive. Small businesses and solo entrepreneurs can now take on the giants, turning data into a real equalizer.
FAQs
What, in very simple terms, is data analytics?
It’s examining data to identify patterns and make informed judgments.
Is data analytics hard for a beginner?
It comes with its challenges; however, structured courses and AI helpers make it very achievable.
What are some popular data analytics tools?
Tableau, Power BI, Python, SQL, and emerging AI options like Julius stand out.
How does the Google Data Analytics Professional Certificate help?
It quickly builds job-ready skills that often result in solid entry-level positions.
What are the key components of a data and analytics framework?
Collection, cleaning, analysis, governance, and clear visualization.
Conclusion
Data analytics is a powerful skill that helps individuals and businesses convert raw data into smarter decisions. This guide covers what data analytics is, if it is hard to learn, what the key data analytics tools are, describes the aspects of the data and analytics framework, and talks about the value of the Google Data Analytics Professional Certificate.
The takeaway is simple: data analytics is not about the numbers themselves but rather about opportunity. With the right tools, frameworks, and learning path, anyone can build data-driven skills that give them a competitive edge in today’s digital world.